Overview
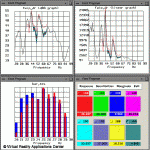
The above image depicts a predicted response to a design variable change. The black line represents the unchanged baseline value, while the red line shows the “predicted” response to design changes. Here the prediction is only available for a small range of frequencies.
This is a Ford Motor Company funded project to develop a prototype visualization tool for multifunction optimization and variability analysis. The software under construction reads baseline results computed by CAE tools (e.g. MSC/NASTRAN), associated design sensitivity analysis (DSA) data, and design variable variability, and uses the data to predict, continuously and interactively, a new system response given changes in design variables. The user interactively inputs design changes by using the mouse to move virtual dials displayed on the screen or by manually turning physical dials on a dialbox connected to the computer. This tool will allow Ford engineers to identify a set of realistic and robust design targets for optimization. This software tool also displays the variability response of the system from design variable changes. The multi-windowing capabilities of today’s workstations allow simultaneous display of results from a multiple of analysis data. When completed, Ford Engineers will be able to look at many different types of analysis data, including noise, vibration, and handling (NVH); safety; durability; and ride/handling; and view both the effects that changing design variables have on these responses and the predicted statistical distribution of those responses.
Additional Media
- Images: The following images represent different aspects of the software. Included are a display of the three sigma variance plot and a view of the virtual dialbox used to change the value of design variables.
Publications
- Gaddipati, Vijoy, Vance, Judy M., DeVries, Richard I. “Visual Interaction in Acoustic-Structural Analysis of Automobiles”, Proceedings of the 1994 ASME Design Automation Conference, DE-Vol. 69-1, Minneapolis, MN, September 12-14, 1994, pp. 65-70.
- Longacre, Kenneth D., Vance, Judy M., “Multi-function Optimization and Visualization Environment”, Motif ’95 Conference Proceedings, Washington D.C., Nov. 16-17, 1995.
- Longacre, Kenneth D., Vance, Judy M., DeVries, Richard I. “A Computer Tool to Facilitate Cross-Attribute Optimization”, Proceedings of the 6th AIAA/NASA/USAF Multidisciplinary Analysis and Optimization Symposium, Bellevue, WA, September 4-6, 1996, pp. 1275-1279.
Personnel
- Judy M. Vance, Principal Investigator, jmvance@iastate.edu
- Ken Longacre, Graduate Research Assistant
- Richard I. DeVries, Ford Motor Company, ph. 313-594-4148
Funding
- Ford Motor Company
