
Overview
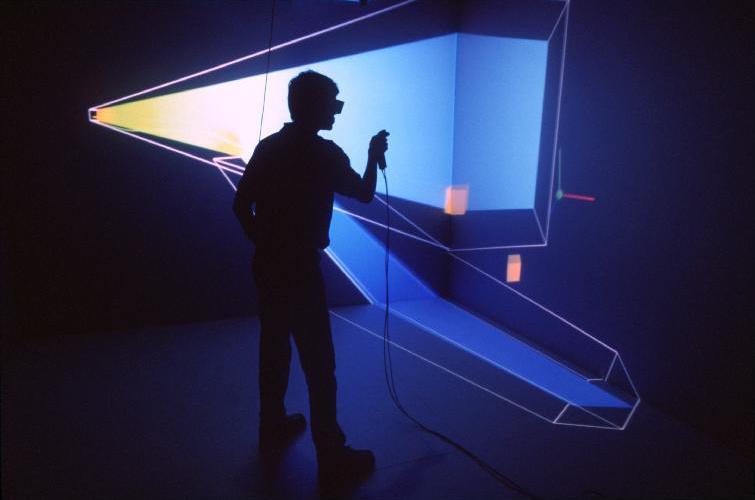
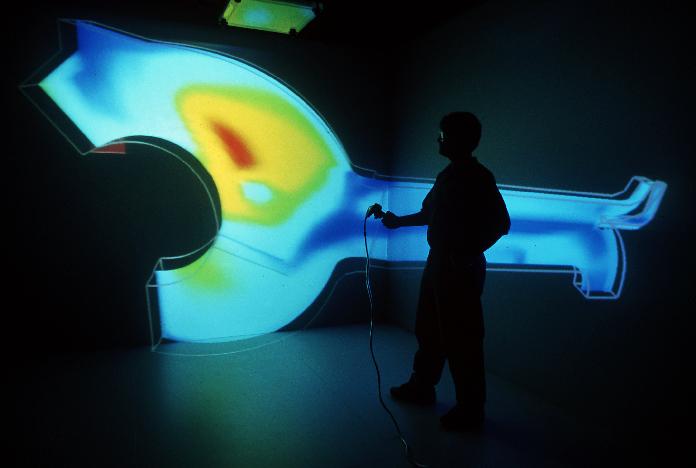
Virtual Reality (VR) provides a fully interactive three dimensional interface in which users can interact with computer generated models. This application is a virtual reality environment for examining the results of computational fluid dynamics analysis and has been titled VR-CFD. This tool has several features for the visualization of CFD data. Some of these features include:
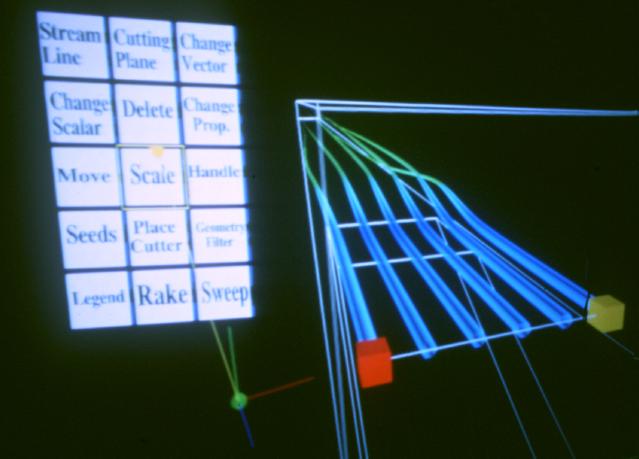
- Streamlines and rakes
- Cutting planes
- Isosurfaces
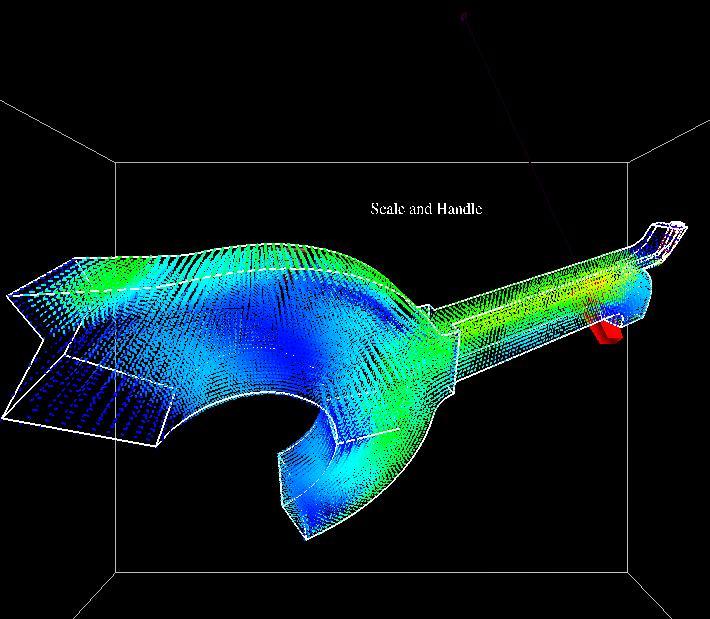
- Vector fields
- Mixing of two particle streams
- Particle animation along the streamlines
- Sweeping cutting planes
- Isolation of “areas of interest”
Several other techniques have been implemented to increase the “user-friendliness” of the application. The application’s “vision” is to facilitate greater interaction, intelligent exploration and an in-depth understanding of the data.
In an effort to extend the functionality of VR-CFD beyond its use as a post pro-cessing tool to that of a design tool, CFD approximation techniques have been investigated and approximation functionality has been added to this tool. Two approximation techniques are used to approximate and visualize the change in the flow characteristics of fluids as changes are made to the model geometry. Users may interactively apply these approximation techniques on post processed computational fluid dynamics (CFD) data in a virtual environment. The virtual knot technique of B-spline curve fitting (Hsieh and Chang, 1994) is used here along with common linear interpolation. Users are allowed to select either method of approximation, parameters for which the response surface needs to be generated. and methods of comparison. Numerical analysis is also performed, to compare the accuracy of the approximations to the actual solutions. The results indicate that either approach would be satisfactory for implementation in a virtual environment, however, the accuracy of the approximations is closely related to the number and spacing of the actual solutions which are available and the complexity of the flow field. For greater interactive ability, methods of parallel programming are implemented, to maintain interactive features during calculations which are detrimental to the immersive capability of the application.
Additional media
- Visualization and immersion in a vector field – Vector Field (250 KB)
- Comparison of two isosurfaces for different values of a duct angle – Isosurfaces (40 KB)
- Streamlines – Streamlines (409 KB)
- Color-mapped cutting plane – Cutting Plane (26 KB)
- Another color-mapped cutting plane – Cutting Plane (24 KB)
- Full field velocity vectors – Vectors (68 KB)
- Menu and rake of streamlines – Rake (31 KB)
Hardware and Software
- Software: OpenGL, Visualization Tool-Kit (VTK), and the C2 libraries.
- Hardware: The C2 virtual environment, n-vision helmet, and the desktop monitor in stereo with 3D interaction.
Publications
- Shahnawaz, V., Vance, J., and Kutti, S., Visualization of Post-Processed CFD Data in a Virtual Environment, 1999 ASME Design Engineering Technical Conference, Sept 12-15,1999, Las Vegas, Nevada, DETC/CIE 9042.
- Shahnawaz, Vishant, Visualization and approximation analysis of post processed computational fluid dynamics data in a virtual environment, M.S. Thesis, Iowa State Univeristy, 2000
Personnel
- Vishant Shahnawaz, Research Assistant, Virtual Reality Application Center, Iowa State University
- Judy Vance, Associate Professor, Dept. of Mechanical Engineering, Iowa State University
Funding
- Procter and Gamble, Cincinnati, Ohio; Virtual Prototyping for Interpretation of Analysis Data